Debugging MSP430 in VS Code
My experience with embedded systems is rather small and related to pet projects only.
So far I’ve been tinkering with 8-bit AVR’s, 16- and 32-bit chips by Texas Instruments and ESP8266 SoCs. I would not count Raspberry Pi in this list (there’s even one Pi Zero working at my home).
And there’s an absolute leader in my personal list: Texas Instruments. Reasons: great documentation, great selection of launchpads and also community. These guys are also crazy about low-power consumption. There are also tradeoffs as always. In my opinion, their standard IDE Code Composer Studio™ is too heavy and not working that great under Linux.
One obvious way to tackle the problem is to use a GCC compiler in combination with VS Code. While playing around with this setup, I found out for myself how gdb works and how lightweight the embedded-development setup might be.
My current setup:
- Arch Linux (Linux version 5.19.6-arch1-1 (linux@archlinux) (gcc (GCC) 12.2.0, GNU ld (GNU Binutils) 2.39.0)
- MSPDebug: the debugging tool
- MSP430Ware: native libs and bindings from Texas Instruments
- Visual Studio Code 1.71.0
- MSP430F5529 Launchpad from ancient 2014 or so
The process
- Create a project and write your code
- Point VS code for libraries in order to use includes in
.vscode/c_cpp_properties.json - Add a
Makefile - Define some tasks for easy debugging in
.vscode/tasks.json{ "version": "2.0.0", "type": "shell", "tasks": [ { "label": "debug-only", "isBackground": true, "command": "mspdebug tilib \"gdb\"", }, ] } - Configure debug configs in
.vscode/launch.jsonfile"configurations": [ { "name": "Debugger", "type": "cppdbg", "request": "launch", "program": "MSP430F5529.out", "miDebuggerPath": "/opt/ti/msp430-gcc/bin/msp430-elf-gdb", "miDebuggerServerAddress": ":2000", "args": [], "stopAtEntry": true, "cwd": "${workspaceFolder}", "environment": [], "externalConsole": false, "logging": { "engineLogging": true }, "preLaunchTask": "debug-only", "serverLaunchTimeout": 100000 // add timeaout because preLaunchTask will run in a background, so we can't really monitor it's status }, ] - Now, we can build and flash the code. Actually, this can also be in a
preLaunchtask as well.
$ make

> /opt/ti/msp430-gcc/bin/msp430-elf-gcc -I /opt/ti/msp430-gcc/include -mmcu=MSP430F5529 -O0 -Wall -g3 -gdwarf-2 -ggdb -L /opt/ti/msp430-gcc/include -Wl,-Map,main.map,--gc-sections  main.o -o MSP430F5529.out

$ mspdebug tilib "prog MSP430F5529.out"

> MSPDebug version 0.25 - debugging tool for MSP430 MCUs

Using new (SLAC460L+) API
MSP430_GetNumberOfUsbIfs
MSP430_GetNameOfUsbIf
Found FET: ttyACM1
MSP430_Initialize: ttyACM1
Firmware version is 31400000
MSP430_VCC: 3000 mV
MSP430_OpenDevice
MSP430_GetFoundDevice
Device: MSP430F5529 (id = 0x002f)
8 breakpoints available
MSP430_EEM_Init
Chip ID data:
  ver_id:         2955
  ver_sub_id:     0000
  revision:       17
  fab:            55
  self:           5555
  config:         12
  fuses:          55
Device: MSP430F5529
Erasing...
Programming...
Writing    2 bytes at ffea [section: __interrupt_vector_54]...
Writing    2 bytes at fffe [section: __reset_vector]...
Writing   14 bytes at 4400 [section: .lowtext]...
Writing   76 bytes at 440e [section: .text]...
Done, 94 bytes total
MSP430_Run
MSP430_Close
Boom, it’s there! Now you can actually debug.
Let’s launch the config from step 4.
Executing task: mspdebug tilib "gdb"

MSPDebug version 0.25 - debugging tool for MSP430 MCUs
Copyright (C) 2009-2017 Daniel Beer <dlbeer@gmail.com>
This is free software; see the source for copying conditions.  There is NO
warranty; not even for MERCHANTABILITY or FITNESS FOR A PARTICULAR PURPOSE.
Chip info database from MSP430.dll v3.3.1.4 Copyright (C) 2013 TI, Inc.

Using new (SLAC460L+) API
MSP430_GetNumberOfUsbIfs
MSP430_GetNameOfUsbIf
Found FET: ttyACM1
MSP430_Initialize: ttyACM1
Firmware version is 31400000
MSP430_VCC: 3000 mV
MSP430_OpenDevice
MSP430_GetFoundDevice
Device: MSP430F5529 (id = 0x002f)
8 breakpoints available
MSP430_EEM_Init
Chip ID data:
  ver_id:         2955
  ver_sub_id:     0000
  revision:       17
  fab:            55
  self:           5555
  config:         12
  fuses:          55
Device: MSP430F5529
Bound to port 2000. Now waiting for connection...
Client connected from 127.0.0.1:39164
Clearing all breakpoints...
Reading registers
Reading    1 bytes from 0x440e
Reading    1 bytes from 0x440f
Reading    1 bytes from 0x4410
Reading    1 bytes from 0x4411
Reading    1 bytes from 0x4412
Reading    1 bytes from 0x4413
Reading    1 bytes from 0x440e
Reading    1 bytes from 0x440f
Reading    1 bytes from 0x4410
Reading    1 bytes from 0x4411
Reading    1 bytes from 0x4412
Reading    1 bytes from 0x4413
Reading    2 bytes from 0x440e
Breakpoint set at 0x440e
Running
Target halted
Breakpoint cleared at 0x440e
Reading    2 bytes from 0x015c
Reading    1 bytes from 0x0204
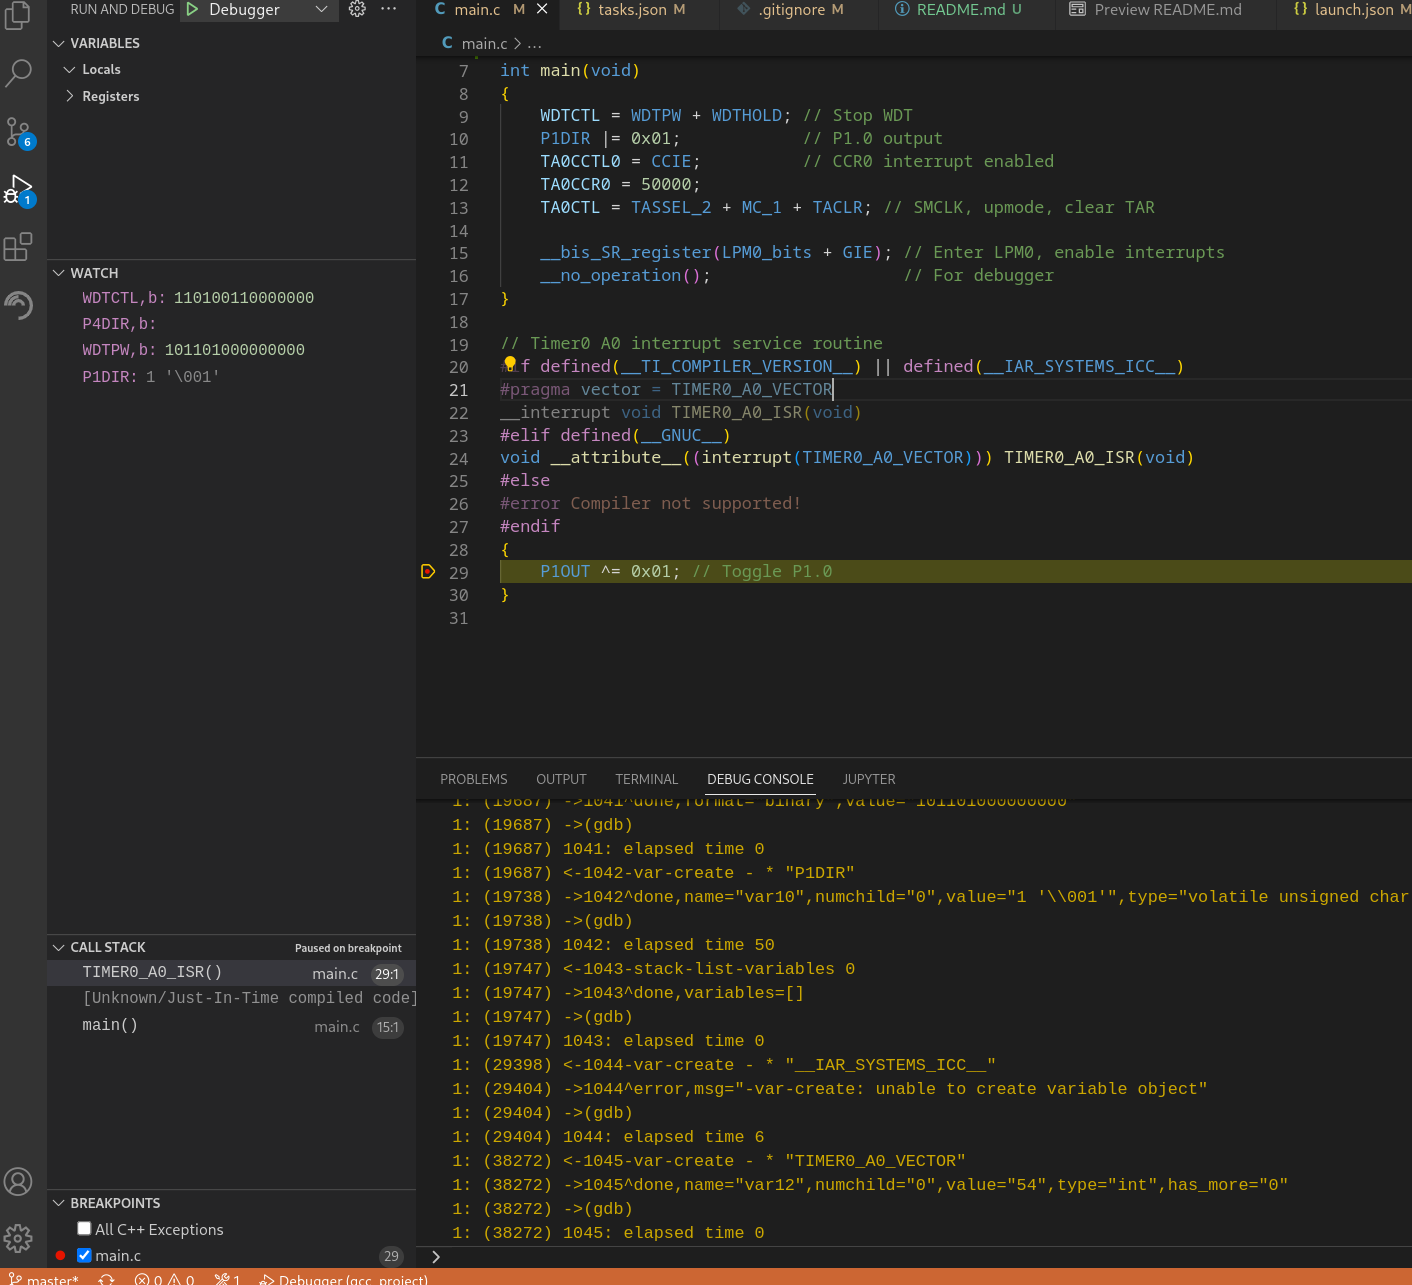
Done. Now you can use breakpoints, access registers and actually debug the code. In the “Debug console” tab you can also see gdb logs.

You can find the complete example of embedded-style “Hello World” application in Github repo
Happy coding!